


April Market Update
April Recap
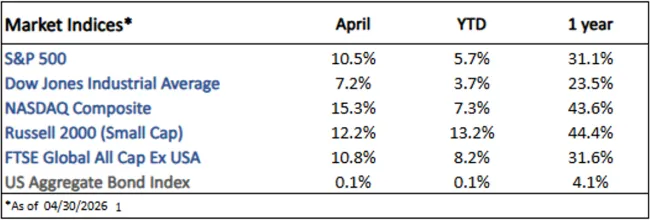
The S&P 500 rose 10.5% in April, recovering from March’s 5% decline and more. The tech-heavy Nasdaq outperformed as technology earnings surprised to the upside, while news of a ceasefire between the U.S. and Iran led global markets higher.1
The benchmark 10yr Treasury yield rose slightly from 4.3% to 4.4% as surging oil prices due to the closure of the Strait of Hormuz pushed inflation expectations higher.2
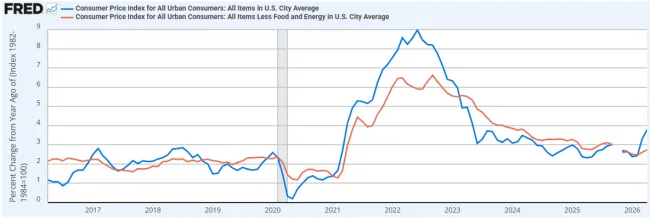
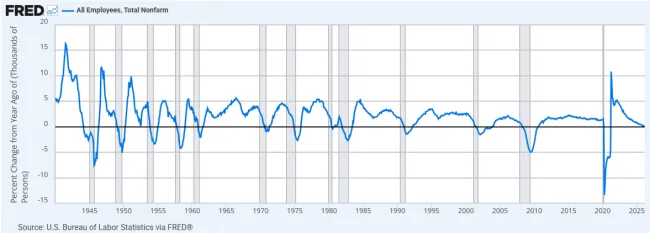
Inflation, measured by the Consumer Price Index (CPI), rose 3.8% year-over-year; core inflation, which excludes food and energy prices, rose 2.8% year-over-year (figure 1). Inflation has now been above the Federal Reserve’s 2% target for five straight years. The economy added 115k jobs and the unemployment rate remained at 4.3%.3 This better-than-expected report was encouraging as jobs growth nears a level historically marked by recession (figure 2).
Current Developments (May)
Markets have continued higher in May as additional positive earnings reports (largely driven by demand for AI) and a continued ceasefire with Iran improved investor sentiment.4
President Trump recently travelled to China with CEOs of America’s largest companies like Tesla’s Elon Musk, Nvidia’s Jensen Huang, and Apple’s Tim Cook for a summit with Chinese President Xi Jinping. The news sent Chinese stocks and the shares of the companies whose CEO’s attended higher.5
The S&P 500 has now rallied over 15% to new all-time highs after a 9% dip in March.
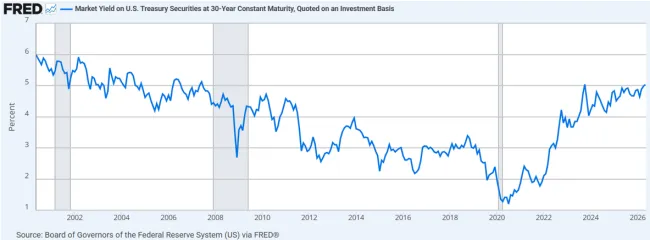
Treasury yields continue to rise after an upside surprise in inflation numbers, as the 30-year is now at levels not seen since the Great Recession (figure 3).6
The Future
We still expect the conflict with Iran to influence the market, especially its impact on oil prices and the resulting upward pressure on inflation and bond yields.
Due to these rising yields and inflation expectations, investors now view a rate hike as more likely than a rate cut, despite investors expecting two cuts at the beginning of the year.7
Q1 earnings are now expected to grow an impressive 27% (led by 50% growth from the Technology sector), up from 13% initially expected. This will mark the sixth straight quarter of double-digit growth. For full-year 2026, earnings are expected to grow 21%.4
Since 1950, May has produced a mediocre average return of 0.3% for the S&P 500.8
1. https://ycharts.com/indices/%5ESPXTR, https://ycharts.com/indices/%5EDJITR, https://ycharts.com/indices/%5ENACTR, https://ycharts.com/indices/%5ERUTTR, https://ycharts.com/indices/%5EMSEAFETR, https://ycharts.com/indices/%5EBBUSATR – Index Performance
2. https://www.cnbc.com/bonds/ - Bond Yields
3. https://www.investing.com/economic-calendar/ - Economic data
4. https://advantage.factset.com/hubfs/Website/Resources%20Section/Research%20Desk/Earnings%20Insight/Earnings Insight_051526.pdf- Earnings
5. https://www.barrons.com/articles/trump-china-summit-ceos-apple-tesla-musk-cbe03eb4 - China summit
6. https://fred.stlouisfed.org/series/MORTGAGE30US - 30y yield
7. https://www.cmegroup.com/markets/interest-rates/cme-fedwatch-tool.html - Investor rate expectations
8. https://www.visualcapitalist.com/charted-average-sp-500-return-by-month-since-1950/– Monthly market history
The Gasaway Team
7110 Stadium Drive
Kalamazoo, MI 49009
(269) 324-0080
FAX (269) 324-3834
The views expressed are those of the author as of the date noted, are subject to change based on market and other various conditions. This presentation is not an offer or a solicitation to buy or sell securities. The material discussed is meant to provide general education information only and it is not to be construed as specific investment, tax or legal advice and does not give investment recommendations.
Certain risks exist with any type of investment and should be considered carefully before making any investment decisions. Keep in mind that current and historical facts not be indicative of future results.
Additional information, including management fees and expenses, is provided on our Form ADV Part 2 available upon request or at the SEC’s Investment Adviser Public Disclosure website, https://adviserinfo.sec.gov/firm/summary/123807.