


February Market Update
February Recap
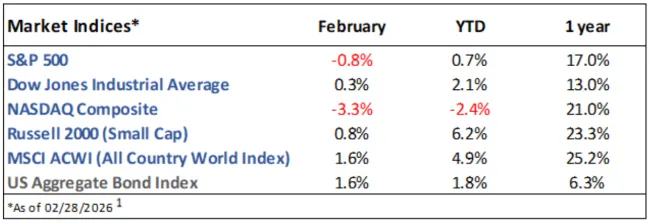
The S&P 500 fell -0.8% in February, its first negative month in ten. International equities continued to perform well, while concerns around AI spending and its potential disruption to the software industry led technology stocks lower.1
The benchmark 10yr Treasury yield dropped from over 4.2% to below 4%, leading to a 1.6% gain for the US Aggregate Bond Index.2
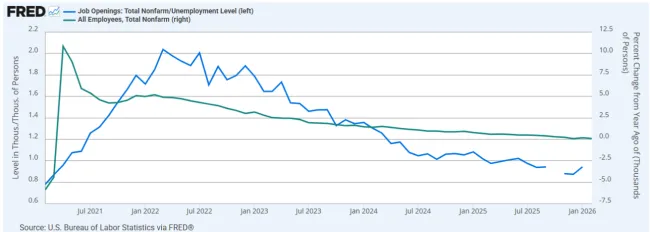
Inflation, measured by the Consumer Price Index (CPI), rose 2.4% year-over-year; April will mark five years above the Federal Reserve’s 2% target (figure 1). The economy lost -92k jobs and the unemployment rate ticked up to 4.4%, further negative news for a labor market that has been weakening since 2022 (figure 1).3
S&P 500 earnings grew 14% in Q4 2025, the fifth straight quarter of double-digit growth.4
The Supreme Court ruled against President Trump’s tariffs implemented under the International Emergency Economic Powers Act (IEEPA). However, the administration instituted a new blanket tariff under Section 122 of the Trade Act of 1974, which will last 150 days. As a result, the average global tariff rate dropped slightly.5
Current Developments (March)
The ongoing conflict in Iran, the U.S.’s involvement, and the resulting impact on oil prices have introduced significant volatility into markets. Similar to the tariff developments in early 2025, markets are reacting dramatically to the frequent announcements coming from the Trump administration, this time regarding the potential duration of the conflict and the U.S.’s objectives. Oil prices have risen from ~$60 in February to over $100 now as the Strait of Hormuz, where ~20% of the world’s oil consumption passes through daily, remains closed. Among other implications, this increase adds yet another challenge to the Federal Reserve’s goal of 2% inflation.6
In response to these inflation concerns, Treasury yields have moved higher, pushing mortgage rates back above 6% after a brief dip below that level.7
The Future
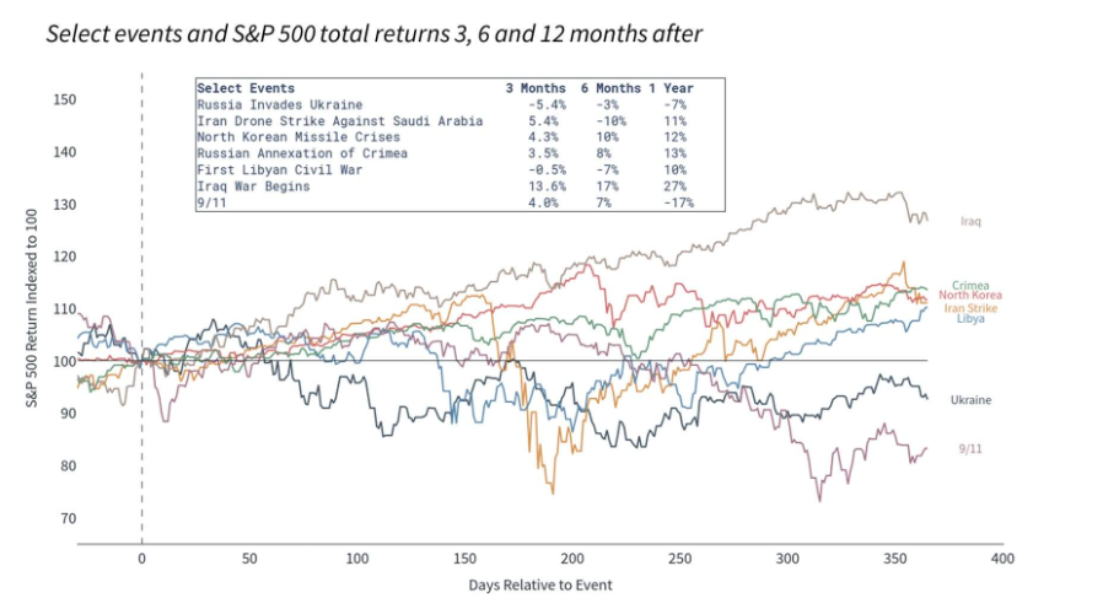
The conflict in Iran and its evolving headlines will likely remain a key driver of market performance until a more permanent resolution is reached. Historically, markets have reacted positively on average to similar geopolitical events (figure 2).
The Federal Reserve is expected to pause interest rate cuts until September, with Wall Street now expecting only one cut in 2026.8
Q1 earnings are expected to grow 12%, which would mark the sixth straight quarter of double-digit growth. For full-year 2026, earnings are expected to grow 15%, with all 11 S&P 500 sectors projected to post positive growth.4
Since 1950, March has produced an average return of over 1% for the S&P 500.9
1. https://ycharts.com/indices/%5ESPXTR, https://ycharts.com/indices/%5EDJITR, https://ycharts.com/indices/%5ENACTR, https://ycharts.com/indices/%5ERUTTR, https://ycharts.com/indices/%5EMSEAFETR, https://ycharts.com/indices/%5EBBUSATR – Index Performance
2. https://www.cnbc.com/bonds/ - Bond Yields
3. https://www.investing.com/economic-calendar/ - Economic data
4. https://advantage.factset.com/hubfs/Website/Resources%20Section/Research%20Desk/Earnings%20Insight/Earnings Insight_120525.pdf – Earnings
5. https://taxpolicycenter.org/taxvox/how-supreme-courts-ieepa-ruling-and-new-section-122-tariffs-reshape-costs-across-industries - Tariffs
6. https://tradingeconomics.com/commodity/crude-oil - Oil Prices
7. https://fred.stlouisfed.org/series/MORTGAGE30US - Mortgage rates
8. https://www.cmegroup.com/markets/interest-rates/cme-fedwatch-tool.html – Investor rate expectations
9. https://www.visualcapitalist.com/charted-average-sp-500-return-by-month-since-1950/– Monthly market history
The Gasaway Team
7110 Stadium Drive
Kalamazoo, MI 49009
(269) 324-0080
FAX (269) 324-3834
The views expressed are those of the author as of the date noted, are subject to change based on market and other various conditions. This presentation is not an offer or a solicitation to buy or sell securities. The material discussed is meant to provide general education information only and it is not to be construed as specific investment, tax or legal advice and does not give investment recommendations.
Certain risks exist with any type of investment and should be considered carefully before making any investment decisions. Keep in mind that current and historical facts November not be indicative of future results.
Additional information, including management fees and expenses, is provided on our Form ADV Part 2 available upon request or at the SEC’s Investment Adviser Public Disclosure website, https://adviserinfo.sec.gov/firm/summary/123807.