


July Market Update
Market Indices Performance
July Recap
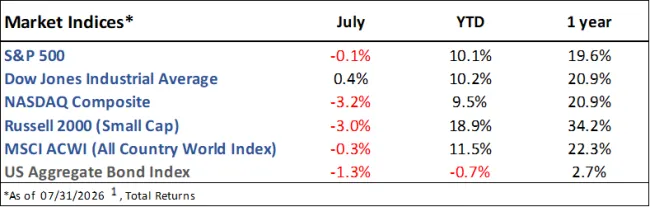
The S&P 500 dipped -0.1% in July. Higher risk sectors like Technology fell more while Energy rose over 12%.1
The benchmark 10yr Treasury climbed from 4.5% to 4.74% while the 30yr hit its highest level in 19 years. As a result, bond prices fell over 1%.2
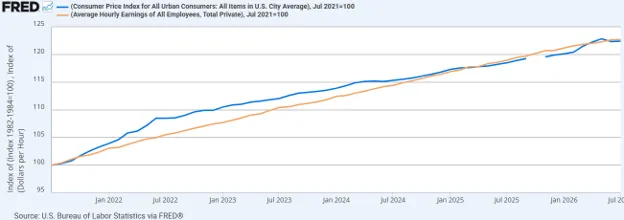
Inflation, measured by the Consumer Price Index (CPI), rose 3.4% year-over-year. Core inflation, which excludes food and energy prices, rose 2.5%, highlighting the impact of higher energy prices on the headline number. Inflation has been above the Federal Reserve’s 2% target for over five years now; however, wage growth has slightly outpaced inflation during that time (Figure 1).3
The labor market continued to weaken in July; employers shed -23k jobs, far short of the 85k gain expected. Additionally, May and June’s numbers were revised down by over 100k jobs. The unemployment rate dropped to 4.1% but was again accompanied by a drop in the labor force participation rate, from 61.5% to 61.4%. As a reminder, the unemployment rate and labor force participation rate falling simultaneously indicates that while most people looking for work are finding it, more and more are dropping out of the labor force entirely.3
The Federal Reserve voted to hold rates steady at 3.50%-3.75%, though 3 of the 12 members voted for a hike.4
Current Developments (August)
Q2 earnings season continued the trend of impressive growth and outperforming expectations, with 50% growth versus the 23% initially expected. Notably, without the unrealized gains from Alphabet and Amazon on their investments in SpaceX and Anthropic, that number would be 32%, still well above expectations.5
The U.S./Iran conflict remains a wild card. The Strait of Hormuz has stayed effectively closed and U.S. blockades on Iranian ports continue. Oil prices remain ~50% above their 2025 lows but are well off their April high.6
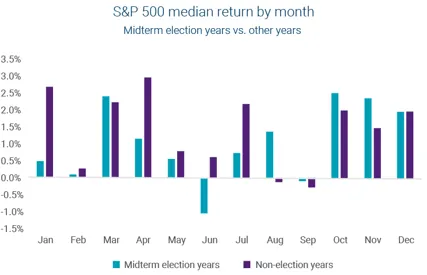
Over June, July, and August, the stock market has performed similarly to historical midterm years – underperforming non-midterm years in June and July and outperforming in August (so far). Should this continue, markets would be in for a positive stretch of returns to end the year (Figure 2).
The Future
Markets are pricing in a 70% chance that the Federal Reserve will hike rates this year, and the majority of the FOMC members agree.4,7
Even hovering around all-time highs, the S&P 500’s forward PE ratio sits around 20, only slightly above the 5-year and 10-year averages of 19.9 and 19.0.8 This would require earnings to continue to keep up with high expectations (27% growth for Q3 and 25% for Q4), but that hasn’t been a problem so far this year.5
We will continue to remain informed on the conflict with Iran as volatile oil prices send waves through the global economy and will influence inflation, bond yields, and the stock market.
Historically, August has been the second worst month of the year for stocks, with the S&P 500 averaging a -0.1% return since 1950.9
1. https://ycharts.com/indices/%5ESPXTR, https://ycharts.com/indices/%5EDJITR, https://ycharts.com/indices/%5ENACTR, https://ycharts.com/indices/%5ERUTTR, https://ycharts.com/indices/%5EMSEAFETR, https://ycharts.com/indices/%5EBBUSATR – Index Performance
2. https://www.cnbc.com/bonds/ - Bond Yields
3. https://www.investing.com/economic-calendar/ - Economic data
4. https://www.federalreserve.gov/monetarypolicy/files/monetary20260729a1.pdf - FOMC Meeting
5. https://advantage.factset.com/hubfs/Website/Resources%20Section/Research%20Desk/Earnings%20Insight/Earnings Insight_080726.pdf - Earnings
6. https://www.foxnews.com/live-news/trump-iran-war-mou-oman-bombing-threat-oil-prices-08-18-26 - Iran conflict
7. https://www.cmegroup.com/markets/interest-rates/cme-fedwatch-tool.html - Investor rate expectations
8. https://en.macromicro.me/series/20052/sp500-forward-pe-ratio - S&P forward PE
9. https://www.visualcapitalist.com/charted-average-sp-500-return-by-month-since-1950/– Monthly market history
The Gasaway Team
7110 Stadium Drive
Kalamazoo, MI 49009
(269) 324-0080
FAX (269) 324-3834
The views expressed are those of the author as of the date noted, are subject to change based on market and other various conditions. This presentation is not an offer or a solicitation to buy or sell securities. The material discussed is meant to provide general education information only and it is not to be construed as specific investment, tax or legal advice and does not give investment recommendations.
Certain risks exist with any type of investment and should be considered carefully before making any investment decisions. Keep in mind that current and historical facts may not be indicative of future results.
Additional information, including management fees and expenses, is provided on our Form ADV Part 2 available upon request or at the SEC’s Investment Adviser Public Disclosure website, https://adviserinfo.sec.gov/firm/summary/123807.