


June Market Update
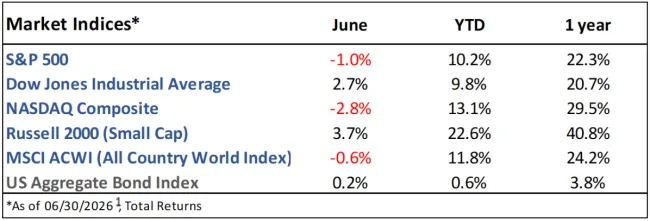
Market Indices Performance
June Recap
The S&P 500 fell -1.0% in June but still ended the quarter up more than 15%. Small cap stocks continued their outperformance in June after years of lagging their large cap counterparts.1
The benchmark 10yr Treasury yield ended the month where it started at 4.5% after a volatile month.2
Inflation, measured by the Consumer Price Index (CPI), rose 3.5% year-over-year, well below expectations of 3.8%. Core inflation, which excludes food and energy prices, rose 2.6%. Inflation has been above the Federal Reserve’s 2% target for over five years now.3
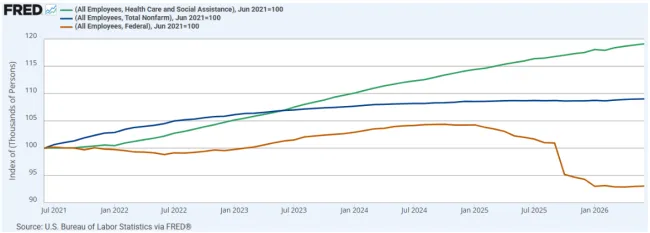
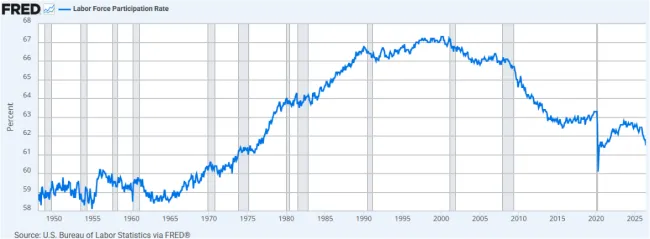
The labor market sent a mixed message. Employers added 57k jobs, far fewer than the 114k expected, with Healthcare and Social Assistance once again doing the heavy lifting (Figure 1). The unemployment rate dropped to 4.2% and remains historically low; however, the labor force participation rate slid to 61.5%, extending a decline that began around 2000 (Figure 2).3 While low unemployment means most people looking for work are finding it, a low labor force participation rate shows that many Americans aren’t working or looking at all, which is a worrying trend for the future.
Current Developments (July)
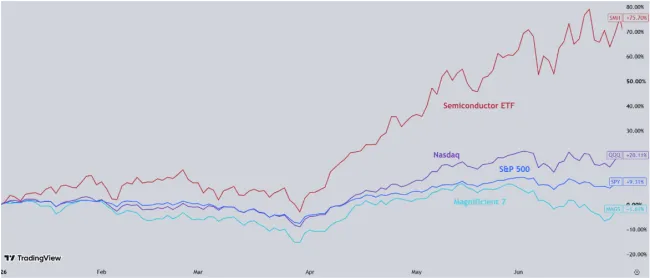
After years of outperformance from the ‘Magnificent 7’ (Apple, Microsoft, Alphabet [Google], Amazon, Meta, Nvidia, and Tesla), there’s a new kid in town: semiconductor stocks.4 Chipmakers have benefited immensely from the major spending of the Magnificent 7 and other ‘hyperscalers’ on AI infrastructure, spending which is anticipated to reach $1 trillion in 2027.5 The VanEck Semiconductor ETF (SMH), which holds names like Broadcom and Micron, finished the 2nd quarter up over 75% on the year. Meanwhile, the Magnificent 7 index was negative (Figure 3).
The interim peace deal between the U.S. and Iran is near collapse. Both sides have resumed strikes and blockades, and the Strait of Hormuz remains effectively closed.6
The Future
Markets are pricing in a 75% chance that the Federal Reserve will hike rates this year; the majority of the FOMC members also anticipate a hike and have reiterated their commitment to price stability.7,8
We will continue to remain informed on the conflict with Iran as volatile oil prices send waves through the global economy and will influence inflation, bond yields, and the stock market.
Q2 earnings season kicks off in mid-July, with analysts anticipating 24% earnings growth. This would mark the 7th straight quarter of double-digit growth.9
Historically, July has been kind to stocks: the S&P 500 has averaged 1.28% during the month since 1950.10
1. https://ycharts.com/indices/%5ESPXTR, https://ycharts.com/indices/%5EDJITR, https://ycharts.com/indices/%5ENACTR, https://ycharts.com/indices/%5ERUTTR, https://ycharts.com/indices/%5EMSEAFETR, https://ycharts.com/indices/%5EBBUSATR – Index Performance
2. https://www.cnbc.com/bonds/ - Bond Yields
3. https://www.investing.com/economic-calendar/ - Economic data
4. https://ppbf.nl/blog/magnificent-7-sp500-concentration - S&P 500 returns from Mag7
5. https://www.spglobal.com/ratings/en/regulatory/article/ai-investment-accelerates-across-us-tech-while-cost-pressures-intensify-broadly-ratings-impact-mostly-positive-s101684007 - Hyperscaler spend
6. https://www.usatoday.com/story/news/world/2026/07/14/iran-us-war-trump-strait-of-hormuz--live/90910381007//- Iran conflict
7. https://www.cmegroup.com/markets/interest-rates/cme-fedwatch-tool.html - Investor rate expectations
8. https://www.federalreserve.gov/newsevents/pressreleases/monetary20260617a.htm - FOMC Statement
9. https://advantage.factset.com/hubfs/Website/Resources%20Section/Research%20Desk/Earnings%20Insight/Earnings Insight_071026.pdf- Earnings
10. https://www.visualcapitalist.com/charted-average-sp-500-return-by-month-since-1950/– Monthly market history
The Gasaway Team
7110 Stadium Drive
Kalamazoo, MI 49009
(269) 324-0080
FAX (269) 324-3834
The views expressed are those of the author as of the date noted, are subject to change based on market and other various conditions. This presentation is not an offer or a solicitation to buy or sell securities. The material discussed is meant to provide general education information only and it is not to be construed as specific investment, tax or legal advice and does not give investment recommendations.
Certain risks exist with any type of investment and should be considered carefully before making any investment decisions. Keep in mind that current and historical facts not be indicative of future results.
Additional information, including management fees and expenses, is provided on our Form ADV Part 2 available upon request or at the SEC’s Investment Adviser Public Disclosure website, https://adviserinfo.sec.gov/firm/summary/123807.