


October Market Update
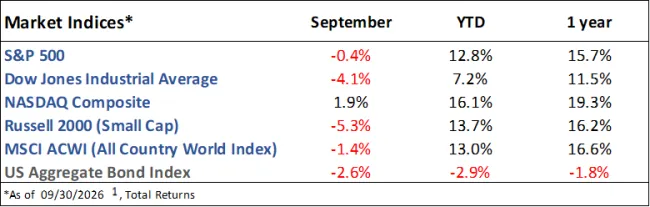
Market Indices Performance
September Recap
The S&P 500 fell 0.4% in September, a small drop considering roughly 75% of the stocks in the index declined and Technology was the one positive sector out of eleven.1,2 The tech-heavy Nasdaq was the only major index to finish the month higher.
The benchmark 10-year Treasury yield rose over half a percentage point from 4.75% to 5.3%.3 The increase was partially driven by a hawkish Federal Reserve which hiked the federal funds rate by 0.25% to the current range of 3.75%-4.00%.4
Inflation, measured by the Consumer Price Index (CPI), rose 3.7% year-over-year and 0.6% month-over-month. Higher energy prices led the increase, with gasoline prices being up 34% from last year and 9% from last month. Core inflation, which excludes volatile food and energy prices, rose 2.6%.5
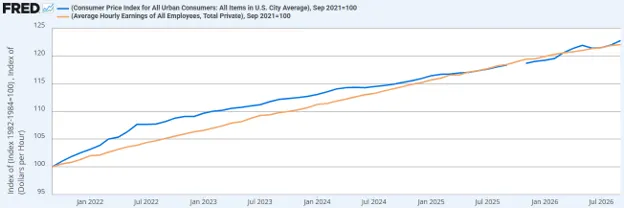
The labor market cooled in September. Employers added 29k jobs (vs 89k expected), July and August’s reports were revised lower by 60k jobs, the unemployment rate rose from 4.1% to 4.2%, and average hourly earnings fell further behind inflation with just a 3.0% year-over-year increase (Figure 1). On a positive note, the labor force participation rate had its second straight positive month, rising from 61.6% to 61.8%.5
Current Developments (October)
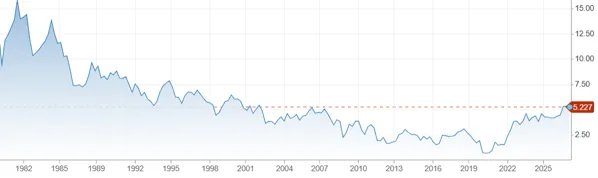
The 10-year Treasury yield has now broken through the ~5% resistance level noted in last month’s update, reaching a peak of 5.34%. That is its highest level since 2002 after its biggest quarterly increase since 1994 (Figure 2).3 This increase can be explained by many factors, including rising inflation and economic growth expectations, increased corporate borrowing (tied to the AI buildout), a consistently hawkish Fed, and the looming $40 trillion national debt.
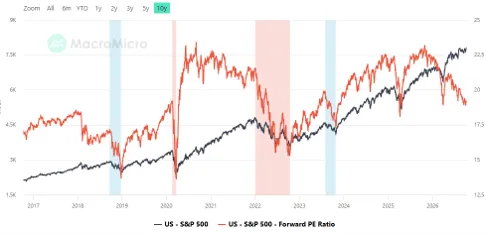
At 19.1x, the S&P 500’s forward PE ratio is below its 5-year average (19.8) and has been steadily diverging from the price of the index (Figure 3). In other words, earnings growth, not rising valuations, has been driving the market higher over the past year.6
President Trump promised no further strikes on Iran until after the midterm elections, but Iran continues to attack ships in the Strait of Hormuz.7 This has kept oil prices near $100/barrel, up from $70/barrel in July, and continues to create uncertainty for investors.8
The Future
Looking ahead, markets face higher interest rates and inflation on one side and strong corporate earnings on the other. Both the Federal Reserve and Wall Street expect a rate hike at the Fed’s December meeting which would bring the federal funds rate to a range of 4.00%-4.25%.4 Higher rates weigh especially on housing and smaller companies that tend to borrow more. They also make stocks relatively less attractive as the “risk-free” rate increases.
Still, stock prices have held up surprisingly well, mostly thanks to these strong earnings. Investors expect S&P 500 earnings to grow 30% in Q3 after 29% growth in Q1 and 52% growth in Q2.9 Whether earnings can outpace the pressure of higher interest rates and inflation remains to be seen.
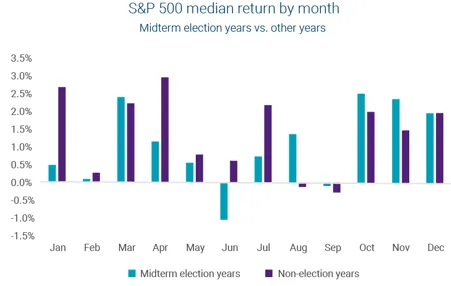
Historically, October is a good month for the S&P 500, averaging a +0.91% return since 1950.10 Additionally, Q4 is historically the best performing quarter for stocks, especially in a midterm election year (Figure 4).
1. https://ycharts.com/indices/%5ESPXTR, https://ycharts.com/indices/%5EDJITR, https://ycharts.com/indices/%5ENACTR, https://ycharts.com/indices/%5ERUTTR, https://ycharts.com/indices/%5EMSEAFETR, https://ycharts.com/indices/%5EBBUSATR – Index Performance
2. https://www.cnbc.com/2026/09/30/broken-market-75percent-of-sp-500-stocks-had-a-lousy-september-.html - S&P 500 in September
3. https://www.cnbc.com/bonds/ - Bond Yields
4. https://www.cmegroup.com/markets/interest-rates/cme-fedwatch-tool.html - Federal funds rate
5. https://www.investing.com/economic-calendar/ - Economic data
6. https://en.macromicro.me/series/20052/sp500-forward-pe-ratio - S&P forward PE
7. https://www.usnews.com/news/world/articles/2026-10-08/trump-says-he-will-not-attack-before-us-elections-in-november - Iran War
8. https://fred.stlouisfed.org/series/DCOILWTICO - WTI Crude Prices
9. https://advantage.factset.com/hubfs/Website/Resources%20Section/Research%20Desk/Earnings%20Insight/Earnings Insight_100926.pdf - Earnings
10. https://www.visualcapitalist.com/charted-average-sp-500-return-by-month-since-1950/– Monthly market history
The Gasaway Team
7110 Stadium Drive
Kalamazoo, MI 49009
(269) 324-0080
FAX (269) 324-3834
The views expressed are those of the author as of the date noted, are subject to change based on market and other various conditions. This presentation is not an offer or a solicitation to buy or sell securities. The material discussed is meant to provide general education information only and it is not to be construed as specific investment, tax or legal advice and does not give investment recommendations.
Certain risks exist with any type of investment and should be considered carefully before making any investment decisions. Keep in mind that current and historical facts may not be indicative of future results.
Additional information, including management fees and expenses, is provided on our Form ADV Part 2 available upon request or at the SEC’s Investment Adviser Public Disclosure website, https://adviserinfo.sec.gov/firm/summary/123807.