


September Market Update
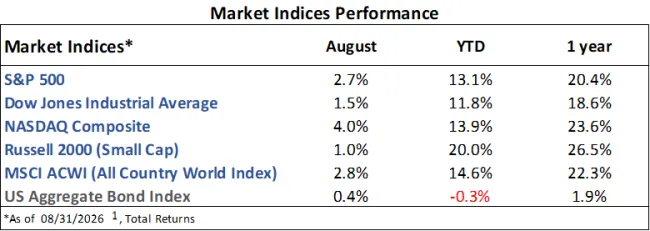
Market Indices Performance
August Recap
The S&P 500 rose 2.7% in August, with all major indices rising alongside it. The rally was supported by another strong earnings season, with S&P 500 Q2 earnings growing 52% year-over-year.1,2
The benchmark 10-year Treasury ended the month slightly higher at 4.75%.3 At the Federal Reserve’s annual conference in Jackson Hole, Chair Kevin Warsh reiterated that inflation remains too high and implied that a rate hike is coming.4
Inflation, measured by the Consumer Price Index (CPI), rose 3.4% year-over-year. Core inflation, which excludes food and energy prices, rose 2.4%, highlighting the impact of higher oil prices on the headline number.5
The labor market surprised to the upside in August; employers added 162k jobs (vs 55k expected), the labor force participation rate ticked up from 61.4% to 61.6%, and the unemployment rate remained at 4.1%.5
Current Developments (September)
Even though they have largely fallen out of the headlines, tariffs remain in place at an average effective rate of ~7% and are estimated to be contributing a meaningful ~0.4% to core inflation.6
The S&P 500’s forward PE ratio has fallen to ~19x, in-line with the 10-year average, an encouraging development as the index remains around all-time-highs.7
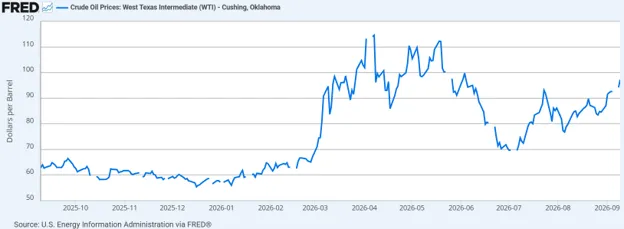
The war in Iran continues and has escalated recently with U.S. strikes on Iranian tankers and Iranian strikes on a U.S. base in Jordan. As a result, oil prices are nearing $100/barrel, over 40% higher than the low in July (Figure 1).
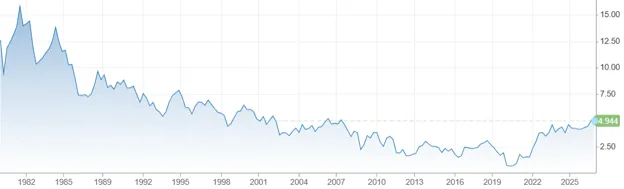
These higher oil prices, inflation expectations, and general uneasiness have sent yields soaring in September, with the 10-year Treasury yield reaching 4.98% at the peak (Figure 2).3 This level, which has acted as resistance over the last few years, presents a challenge for the government as they refinance trillions worth of debt in the near future. To counteract this, Treasury Secretary Scott Bessent announced that they would triple their longer-term bond buyback program from $2 billion to $6 billion.8 However, this likely won’t have much effect on a bond market worth over $30 trillion, which explains why rates continued higher after the announcement.
The Future
Due to these elevated inflation risks, markets are now pricing in a 90% chance that the Federal Reserve will hike rates at their September 16-17 meeting.9
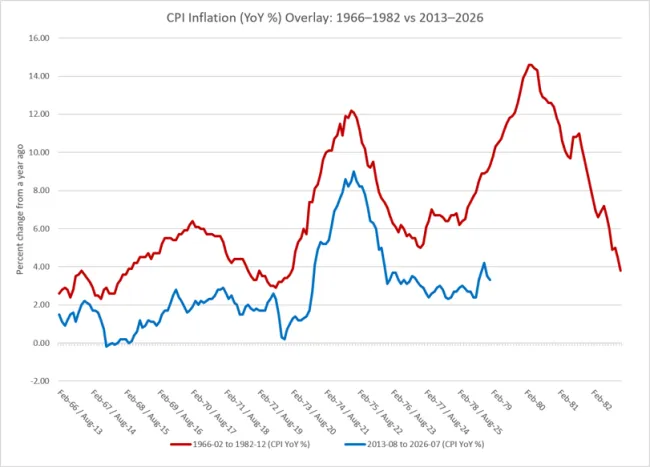
While inflation has fallen far from its 2022 peak, it has remained above the Fed’s 2% target for over five years now. Since 2013, its pattern has shown similarities to the inflationary environment of the 1970s, when two major oil shocks contributed to significant increases in prices (Figure 3). While the economic conditions are very different today, the comparison highlights the risk that continued conflict in the Middle East could reignite inflation.
Encouragingly, future earnings expectations remain strong, with analysts expecting 28% growth for Q3 and 26% growth for Q4, resulting in 32% growth for 2026 overall.2 The key question for investors is whether this impressive growth can continue to outpace the pressure of higher yields and persistent inflation.
Finally, September is historically the weakest month for the S&P 500, averaging a -0.72% return since 1950.10
1. https://ycharts.com/indices/%5ESPXTR, https://ycharts.com/indices/%5EDJITR, https://ycharts.com/indices/%5ENACTR, https://ycharts.com/indices/%5ERUTTR, https://ycharts.com/indices/%5EMSEAFETR, https://ycharts.com/indices/%5EBBUSATR – Index Performance
2. https://advantage.factset.com/hubfs/Website/Resources%20Section/Research%20Desk/Earnings%20Insight/Earnings Insight_090426.pdf - Earnings
3. https://www.cnbc.com/bonds/ - Bond Yields
4. https://www.federalreserve.gov/newsevents/speech/warsh20260828a.htm - Jackson Hole speech
5. https://www.investing.com/economic-calendar/ - Economic data
6. https://www.minneapolisfed.org/article/2026/initially-delayed-the-pass-through-of-tariffs-to-consumer-prices-has-arrived - Tariffs
7. https://en.macromicro.me/series/20052/sp500-forward-pe-ratio - S&P forward PE
8. https://www.cnbc.com/2026/09/09/treasury-department-to-buy-back-6-billion-in-longer-term-debt-triple-the-normal-level.html - Bessent Buybacks
9. https://www.cmegroup.com/markets/interest-rates/cme-fedwatch-tool.html - Investor rate expectations
10. https://www.visualcapitalist.com/charted-average-sp-500-return-by-month-since-1950/– Monthly market history
The Gasaway Team
7110 Stadium Drive
Kalamazoo, MI 49009
(269) 324-0080
FAX (269) 324-3834
The views expressed are those of the author as of the date noted, are subject to change based on market and other various conditions. This presentation is not an offer or a solicitation to buy or sell securities. The material discussed is meant to provide general education information only and it is not to be construed as specific investment, tax or legal advice and does not give investment recommendations.
Certain risks exist with any type of investment and should be considered carefully before making any investment decisions. Keep in mind that current and historical facts may not be indicative of future results.
Additional information, including management fees and expenses, is provided on our Form ADV Part 2 available upon request or at the SEC’s Investment Adviser Public Disclosure website, https://adviserinfo.sec.gov/firm/summary/123807.