January Market Update
January Recap
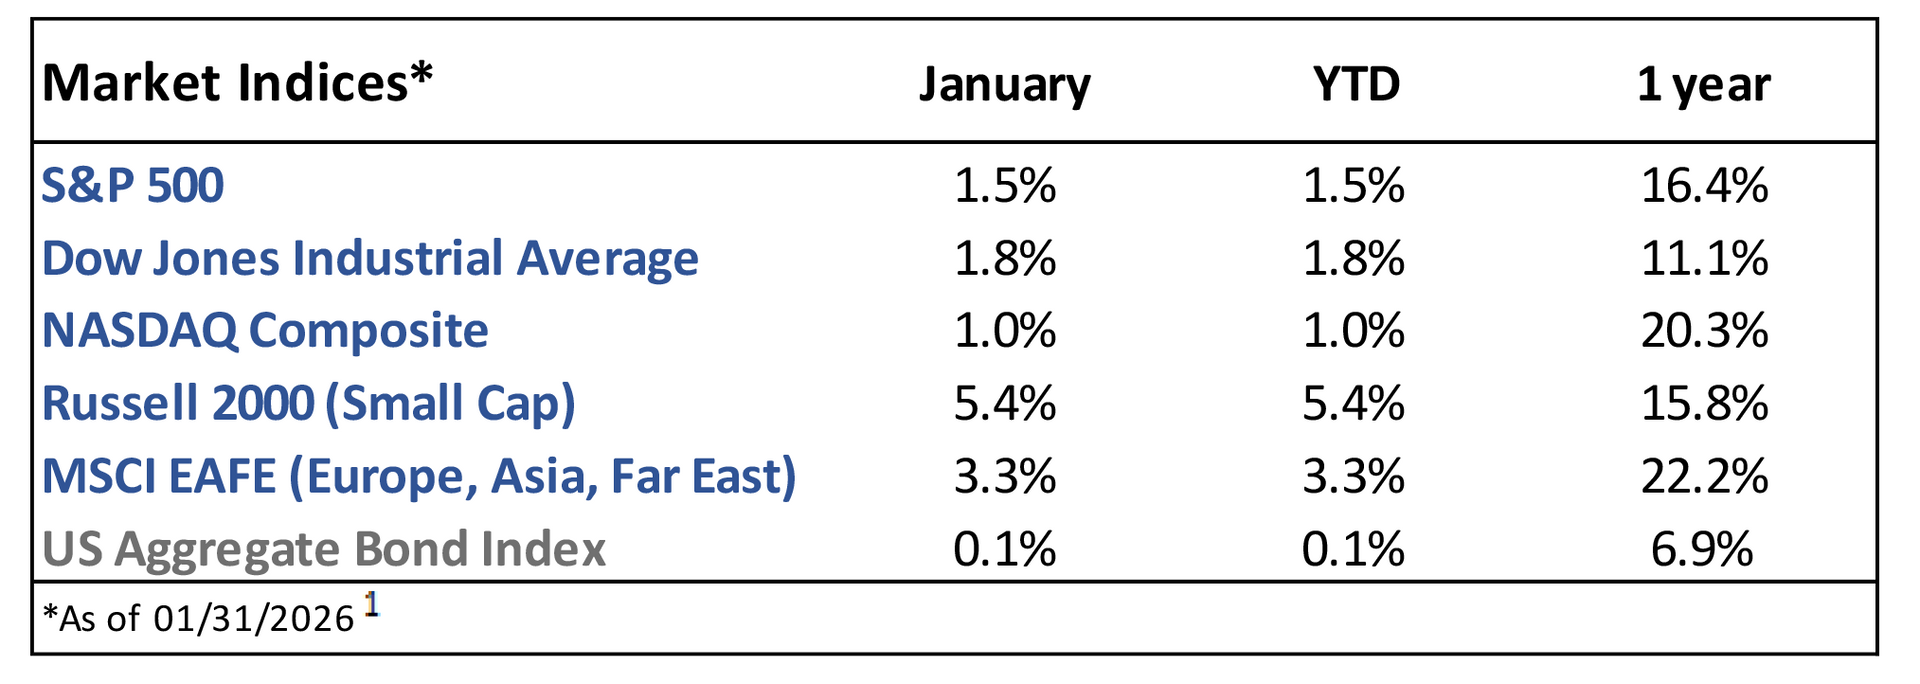
he S&P 500 rose 1.5% in January, starting 2026 with its ninth straight positive month. All major indices finished higher, led by small cap stocks, which have lagged over the past few years. Continued weakening in the U.S. dollar helped lead international stocks higher.1
The benchmark 10yr Treasury yield finally broke above 4.2% following President Trump’s announcement of potential tariffs on specific European countries, though it has now fallen back below 4.2% as the tariffs were walked back.2
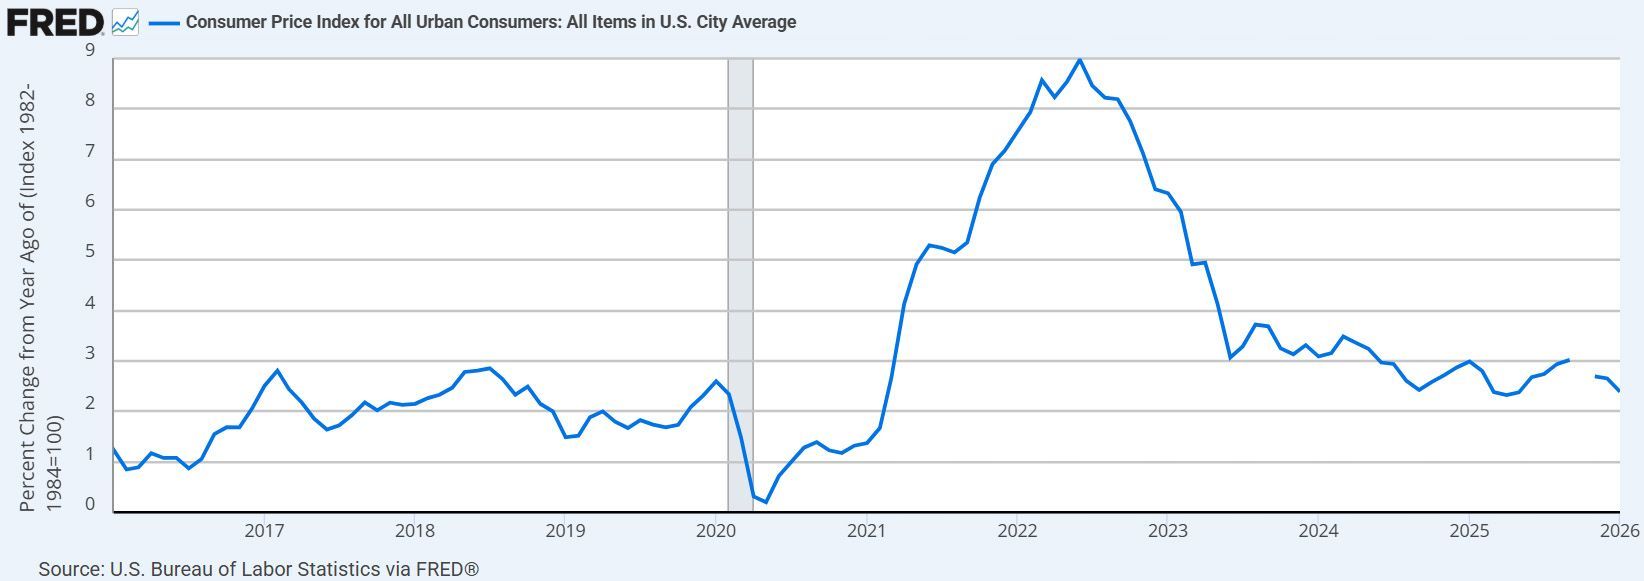
Inflation, measured by the Consumer Price Index (CPI), rose 2.4% year-over-year and is nearing its fifth consecutive year above the Federal Reserve’s 2% target (figure 1). The economy added 130k jobs and the unemployment rate fell to 4.3%, both encouraging numbers after jobs grew at the slowest pace since 2003 in 2025 (not including recession years).3
Current Developments (February)
Q4 earnings season is underway, with expectations for 13% earnings growth, well above the 8% initially expected. This would mark the 5th consecutive quarter of double-digit earnings growth for the S&P 500.4
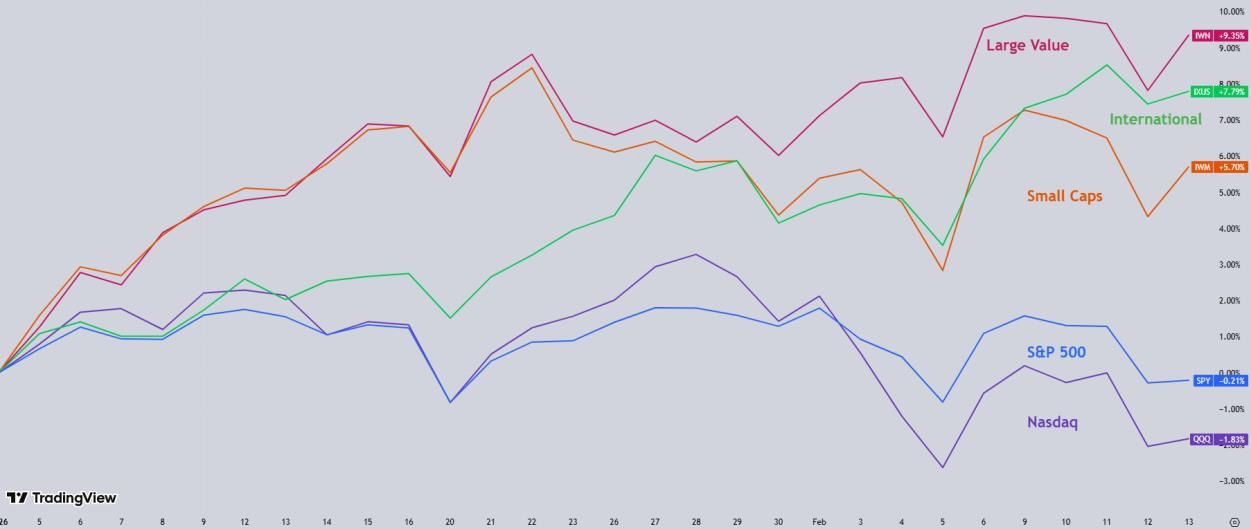
Large Growth and Technology stocks, which dominated performance in recent years, have continued January’s trend of underperformance versus international, small cap, and value stocks (figure 2). Earnings estimates for these other sectors have improved while the AI hype that helped drive technology stocks to elevated valuations is giving way to concerns around profitability and return on investment.1
Mortgage rates remain near their lowest level in 3 years of 6.1% after several interest rate cuts.5
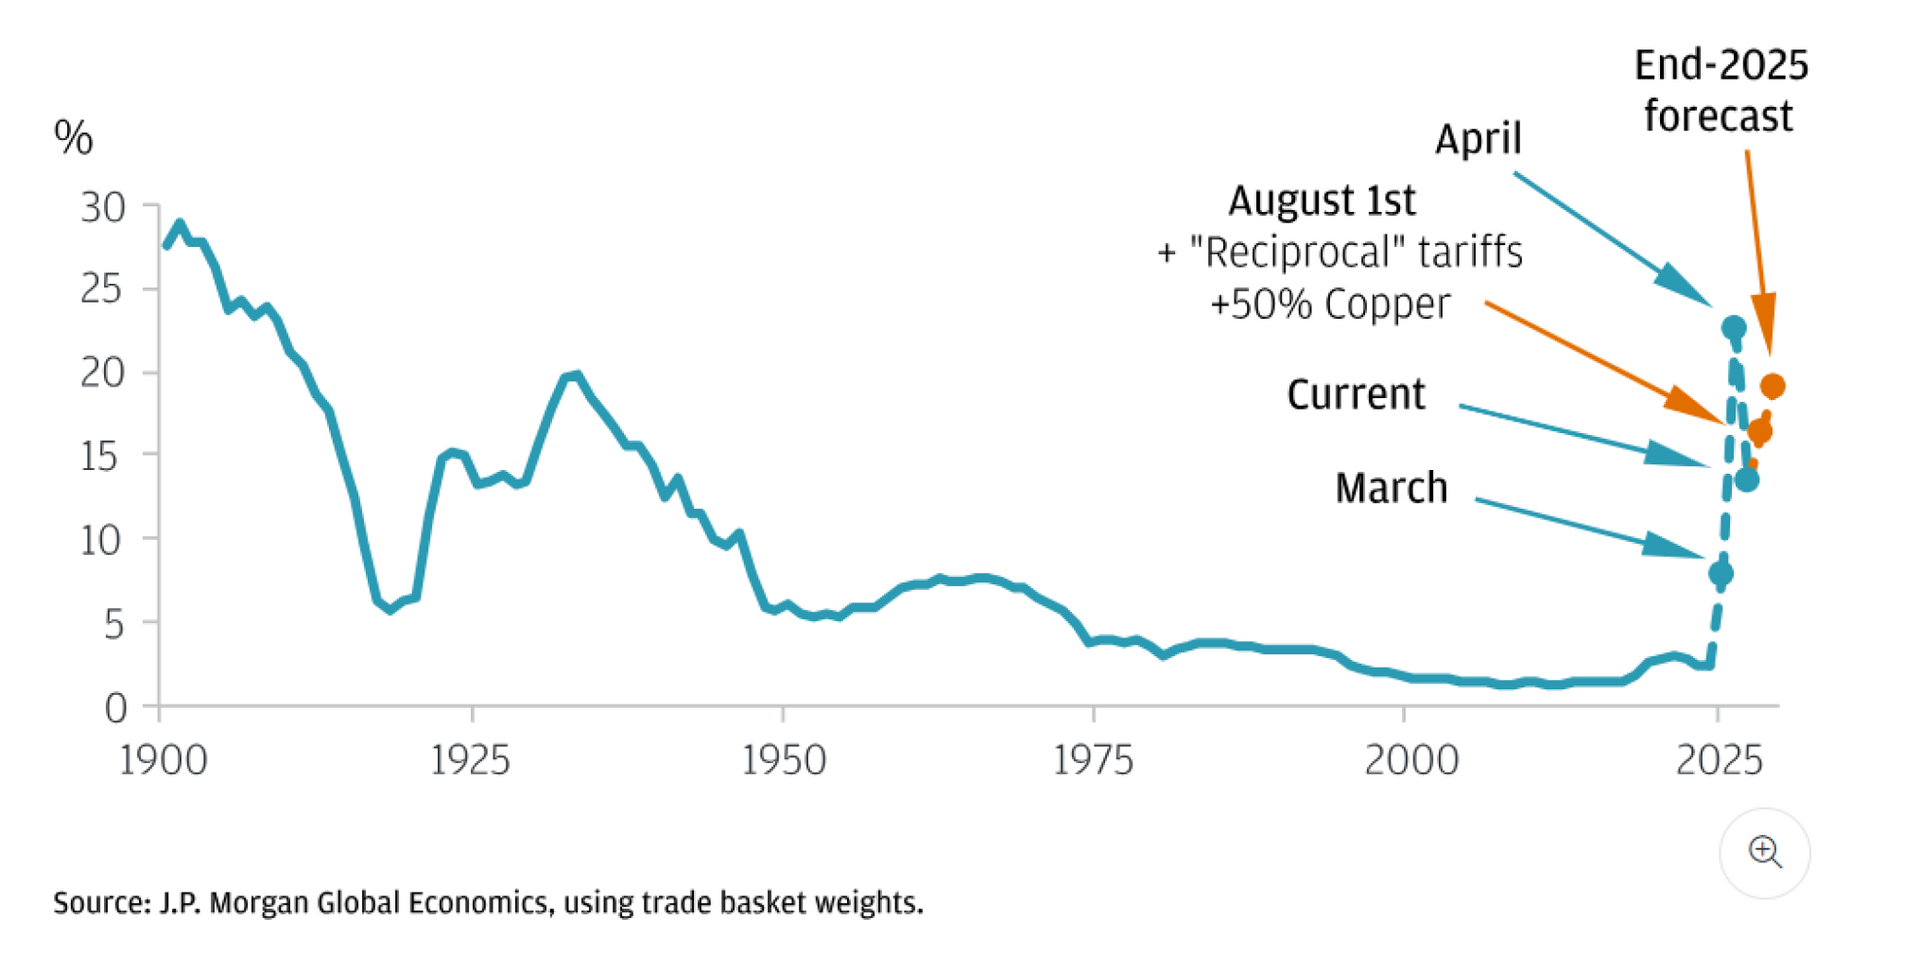
The United States ended 2025 with an average tariff rate of roughly 17%, the highest level since the 1930’s (figure 3). This includes average rates of 10-15% on key trading partners like Mexico, Canada, Japan, and much of the EU, while China and India’s rates sit over 30%. Recently, President Trump has decreased tariffs on certain key countries (like India) and goods (like steel and aluminum).6
The Future
After three delays, the Supreme Court still has yet to rule on whether President Trump’s tariffs, enacted under the International Emergency Economic Powers Act (IEEPA), are lawful. If the Court rules against the Trump administration, the administration will likely attempt alternative methods to reinstate them, though existing tariff revenue may have to be refunded somehow.7
The Federal Reserve is expected to pause interest rate cuts until July, with Wall Street predicting a total of two cuts in 2026.8 Fed Chair Jerome Powell’s term ends in May 2026, and President Trump has nominated Kevin Warsh as his replacement, pending Senate confirmation. While Warsh has historically held hawkish views on monetary policy, he has recently advocated for lower rates.9
In 2026, earnings are expected to grow 14%, with all 11 S&P 500 sectors projected to post positive growth.4
Q4 GDP is expected to grow at over 3.5%.10
Since 1950, February has been a negative month on average and the second worst overall for the S&P 500.11
1. https://ycharts.com/indices/%5ESPXTR, https://ycharts.com/indices/%5EDJITR, https://ycharts.com/indices/%5ENACTR, https://ycharts.com/indices/%5ERUTTR, https://ycharts.com/indices/%5EMSEAFETR, https://ycharts.com/indices/%5EBBUSATR – Index Performance
2. https://www.cnbc.com/bonds/ - Bond Yields
3. https://www.investing.com/economic-calendar/ - Economic data
4. https://advantage.factset.com/hubfs/Website/Resources%20Section/Research%20Desk/Earnings%20Insight/Earnings Insight_120525.pdf – Earnings
5. https://fred.stlouisfed.org/series/MORTGAGE30US - Mortgage rates
6. https://www.atlanticcouncil.org/programs/geoeconomics-center/trump-tariff-tracker/ - Tariff rates
7. https://www.crfb.org/blogs/tariff-revenue-soars-fy-2025-amid-legal-uncertainty - Tariff legality
8. https://www.cmegroup.com/markets/interest-rates/cme-fedwatch-tool.html – Investor rate expectations
9. https://global.morningstar.com/en-nd/economy/what-kevin-warsh-fed-chair-could-mean-interest-rates - Kevin Warsh
10. https://www.atlantafed.org/research-and-data/data/gdpnow – GDP estimate
11. https://www.visualcapitalist.com/charted-average-sp-500-return-by-month-since-1950/– Monthly market history
The Gasaway Team
7110 Stadium Drive
Kalamazoo, MI 49009
(269) 324-0080
FAX (269) 324-3834
The views expressed are those of the author as of the date noted, are subject to change based on market and other various conditions. This presentation is not an offer or a solicitation to buy or sell securities. The material discussed is meant to provide general education information only and it is not to be construed as specific investment, tax or legal advice and does not give investment recommendations.
Certain risks exist with any type of investment and should be considered carefully before making any investment decisions. Keep in mind that current and historical facts November not be indicative of future results.
Additional information, including management fees and expenses, is provided on our Form ADV Part 2 available upon request or at the SEC’s Investment Adviser Public Disclosure website,
https://adviserinfo.sec.gov/firm/summary/123807.
This material was created for educational and informational purposes only and is not intended as ERISA, tax, legal, or investment advice. If you are seeking investment advice specific to your needs, such advice services must be obtained on your own separate from this educational material. ©401(k) Marketing, LLC. All rights reserved. Proprietary and confidential. Do not copy or distribute outside original intent.