June Market Update
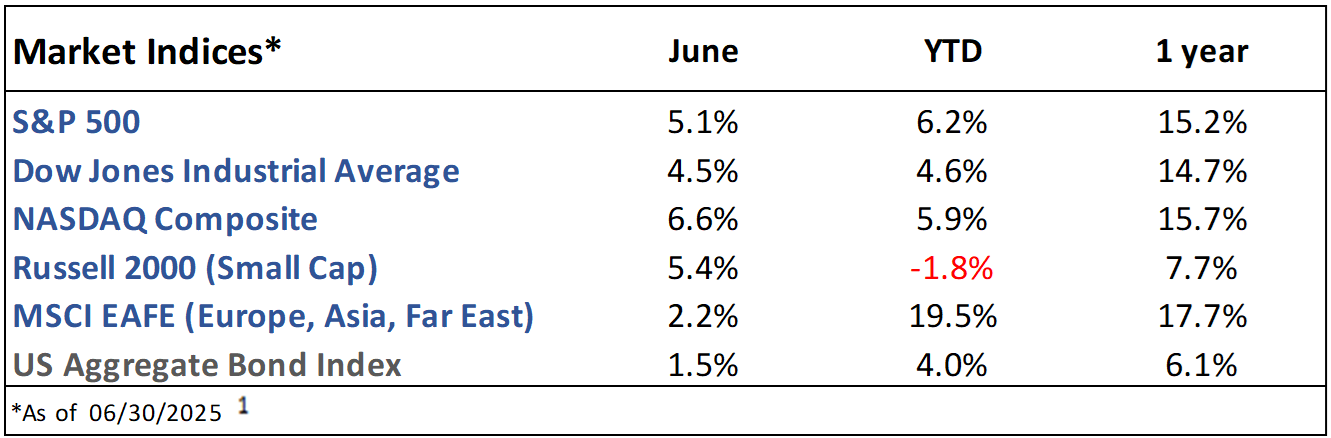
Market Indices Performance
June Recap
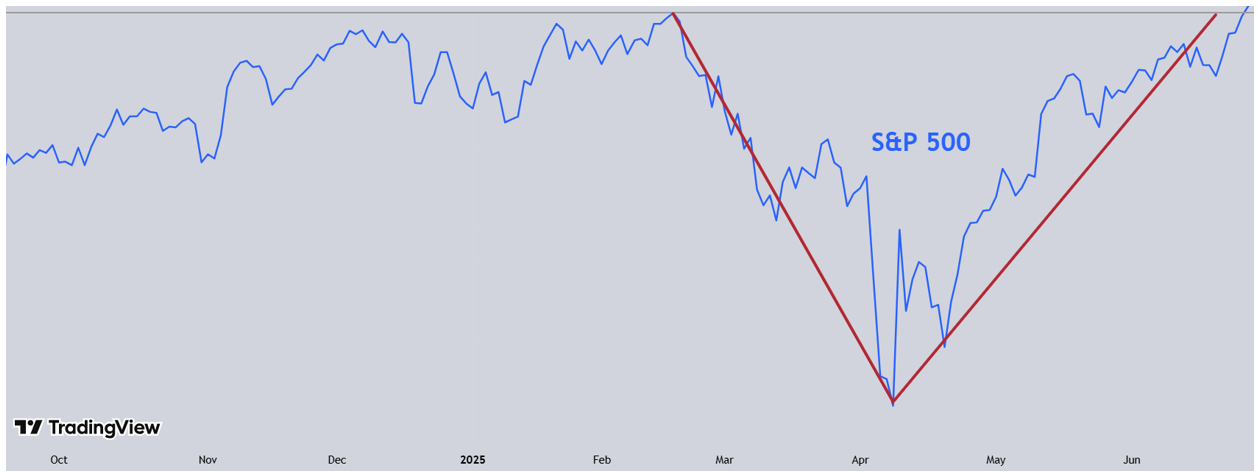
The S&P 500 rose 5.1% in June, hitting a new all-time high late in the month to close out a volatile first half of the year.1 The recovery was sharp and sudden as investors shrugged off the trade war worries and geopolitical concerns that fueled the decline (see figure 1). Longer-term bond yields dropped as investors tempered expectations of increased inflation. 2
Inflation, measured by the Consumer Price Index (CPI), rose 2.7% year-over-year, marking the 51st consecutive month above the Federal Reserve’s 2% target.3 The labor market remained strong: employers added 147k jobs and the unemployment rate ticked down to 4.1%. The unemployment rate has remained below 4.5% since 2021.4 Job openings totaled 7.8m, pushing the ratio of openings to unemployed people solidly back above 1.5
Current Developments (July)
President Trump recently announced 30% tariffs on the European Union and Mexico starting August 1.6 While this decision could have major implications for the economy and the market, it appears that tariff headlines have lost their shock value as frequent deadline extensions and few tangible effects have made investors calloused to the news.
President Trump signed the “One Big Beautiful Bill” into law over the 4th of July weekend. It permanently extends the individual income tax brackets set in 2017, allows deductions for tips, overtime pay, and those over 65 years old, and establishes “Trump accounts” - savings accounts for children born between 2025 and 2028, each initially funded with a $1,000 government contribution into a selected investment.7
The Future
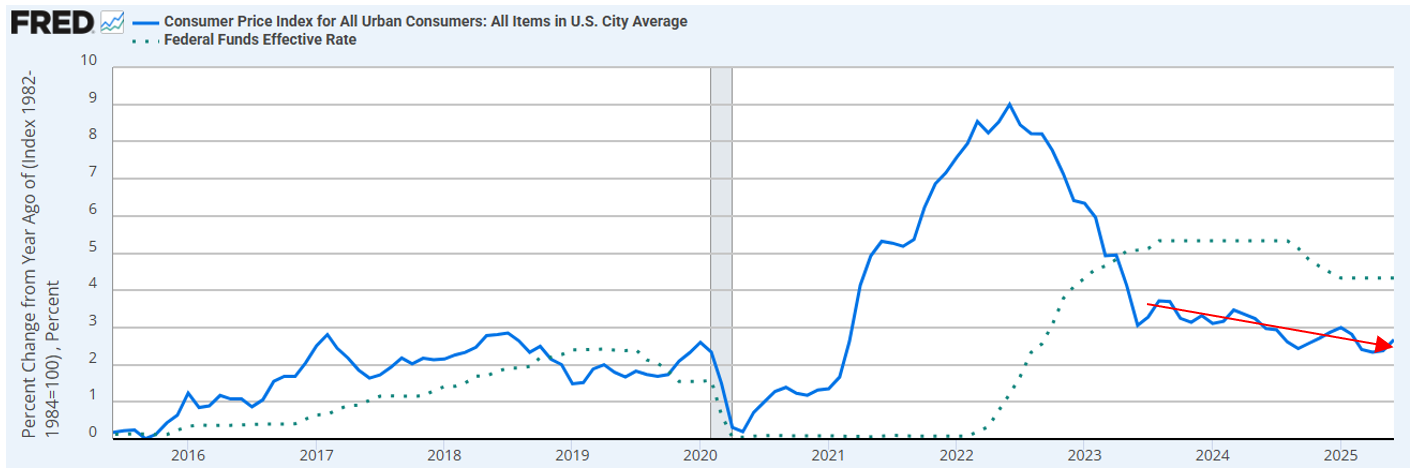
Analysts expect 5% earnings growth for the S&P 500 in Q2 and 9% for the full year.8 Both Wall Street and the Federal Reserve still anticipate two interest rate cuts in 2025.9,10 President Trump has continued to call for the Federal Reserve to cut rates to lower borrowing costs for consumers and refinancing costs for the Treasury. Potential tariff-driven inflation and a historically strong labor market have given the Fed pause on cutting, even though inflation has been trending lower (see figure 2).
July is historically the best month of the year for stocks.11 After negative GDP growth in Q1, second quarter GDP growth is forecasted to be positive.12 President Trump’s reciprocal tariff pause initially set to expire on July 9 has been extended to August 1.6
1. https://ycharts.com/indices/%5ESPXTR, https://ycharts.com/indices/%5EDJITR, https://ycharts.com/indices/%5ENACTR, https://ycharts.com/indices/%5ERUTTR, https://ycharts.com/indices/%5EMSEAFETR, https://ycharts.com/indices/%5EBBUSATR – Index Performance
2. https://www.cnbc.com/quotes/US10Y/- 10yr Treasury Yield
3. https://www.investing.com/economic-calendar/cpi-733- CPI
4. https://www.investing.com/economic-calendar/nonfarm-payrolls-227 - Jobs reports
5. https://fred.stlouisfed.org/series/JTSJOL- Job openings
6. https://taxfoundation.org/research/all/federal/trump-tariffs-trade-war/- Tariff tracker
7. https://www.wealthenhancement.com/blog/one-big-beautiful-tax-bill - Big Beautiful Bill
8. https://advantage.factset.com/hubfs/Website/Resources%20Section/Research%20Desk/Earnings%20Insight/EarningsInsight_071125.pdf - Earnings
9. https://www.cmegroup.com/markets/interest-rates/cme-fedwatch-tool.html – Investor rate expectations
10. https://www.jpmorgan.com/insights/outlook/economic-outlook/fed-meeting-June-2025- Fed Outlook
11. https://www.nasdaq.com/articles/heres-the-average-stock-market-return-in-every-month-of-the-year – Monthly market history
12. https://www.atlantafed.org/cqer/research/gdpnow- Q2 GDP
The Gasaway Team
7110 Stadium Drive
Kalamazoo, MI 49009
(269) 324-0080
FAX (269) 324-3834
The views expressed are those of the author as of the date noted, are subject to change based on market and other various conditions. This presentation is not an offer or a solicitation to buy or sell securities. The material discussed is meant to provide general education information only and it is not to be construed as specific investment, tax or legal advice and does not give investment recommendations.
Certain risks exist with any type of investment and should be considered carefully before making any investment decisions. Keep in mind that current and historical facts may not be indicative of future results.
Additional information, including management fees and expenses, is provided on our Form ADV Part 2 available upon request or at the SEC’s Investment Adviser Public Disclosure website, https://adviserinfo.sec.gov/firm/summary/123807.
This material was created for educational and informational purposes only and is not intended as ERISA, tax, legal, or investment advice. If you are seeking investment advice specific to your needs, such advice services must be obtained on your own separate from this educational material. ©401(k) Marketing, LLC. All rights reserved. Proprietary and confidential. Do not copy or distribute outside original intent.